How to measure a brand's visibility in AI answers: the method, step by step
Measuring AI visibility means counting how often a brand shows up across hundreds of answers. Which questions to ask, in which environment, how many times, and how to read the margin of error.
Part of the topic Measuring AI visibility →
Measuring a brand’s visibility in AI answers means counting how many answers, out of a large set, mention it. The method comes down to five decisions: which questions to ask, in which environment, how many times, how to extract the brands and how to read the margin of error. With 1,000 answers per question, each brand’s presence is measured within ±3.1 percentage points, according to the methodological study FA-MET-01, “How to Measure What an AI Recommends”, published by First Answer in April 2026, with 7,000 runs in the ChatGPT interface.
This guide puts together what has actually been measured on the subject, with the method in the open. It is not a substitute for a tool. It is the yardstick for judging any “AI visibility” number put in front of you, including the ones I publish. A disclosure up front: I am the co-founder and CTO of First Answer, which ran the FA-MET studies cited here.
Why a screenshot measures nothing
The same question, asked twice to the same AI, returns different brands. SparkToro tested this with 600 volunteers, who ran 12 prompts through ChatGPT, Claude and Google’s AI 2,961 times in November and December 2025. Rand Fishkin’s conclusion: there is less than a 1 in 100 chance that ChatGPT or Google’s AI will give the same list of brands in two answers. In the same order, closer to 1 in 1,000.
That does not mean there is no pattern. It means the pattern only shows up at scale. I covered the reasons for the variation in why AI gives a different answer every time. This guide is about what to do with it.
What to measure: presence, position and citation
- Presence: the percentage of answers that mention the brand. It is the main metric, because it is the one that converges to a stable value as the sample grows.
- Position: the order in which the brand appears. Far less stable. In the SparkToro study, City of Hope hospital appeared in 69 of 71 ChatGPT answers (97%), but was mentioned first in only 25 of them.
- Citation: when the answer links to a page. It shows which sources the AI used, which is not the same as naming the brand in the text.
- Share of voice: the share of a category’s mentions that goes to each brand. It comes from the same count as presence.
Step 1: pick the questions your customer would ask
Write the questions the way a consumer would type them, without your brand’s name. That is what the FA-MET studies do: one fixed question per experiment, in the words of someone choosing a product.
One question does not represent a category, because people ask in very different ways. SparkToro asked 142 people to write a prompt about headphones, and the average semantic similarity between them was 0.081, close to zero. Build a set of questions per topic that covers how your customers actually phrase them.
Step 2: state the environment
The same model answers differently depending on where the question is asked. The second study in the series, FA-MET-02, “API or Interface: That Is the Question”, asked the same question 1,000 times through the ChatGPT API, the access developers use, and 1,000 times through the consumer interface, on the same day and with the same search tool:
- 12 of the 15 most relevant brands differed significantly between the two environments.
- One brand went from 11.1% in the API to 92.6% in the interface. Another, from 66.5% to 6.4%.
- Of the 56 brands observed, 64% appeared in only one environment.
Measuring through the API is cheaper and easier to automate, but it measures a different system. If the question is “what does the consumer see”, the measurement has to happen where the consumer is. And each AI is its own environment: ChatGPT, Gemini, Perplexity and Google’s AI answers have to be measured one by one.
Step 3: size the sample by the goal
Precision depends only on the number of runs and on the brand’s own presence. The table below is from FA-MET-01, with margins at 95% confidence:
| Goal | Runs per question | What it delivers |
|---|---|---|
| Initial diagnosis | 100 to 200 | Whether the market is concentrated and who leads it (±7 to 10 pp) |
| Visible hierarchy | 1,000 | Presence within ±3 pp; reliable order between brands more than ~6 pp apart |
| Change between rounds | 1,000 per round | Changes above ~4.4 pp (presence near 50%) can be told apart from noise |
| ±1 pp precision | ~9,600 | Presence within ±1 pp at any level |
| Tail down to 0.1% | ~3,000 | 95% chance of seeing each brand with 0.1% presence at least once |
The study checked whether the math holds in practice. Extending one experiment from 1,000 to 5,000 runs, none of the top ten brands moved outside the predicted margin, and the largest change was 2.9 points.
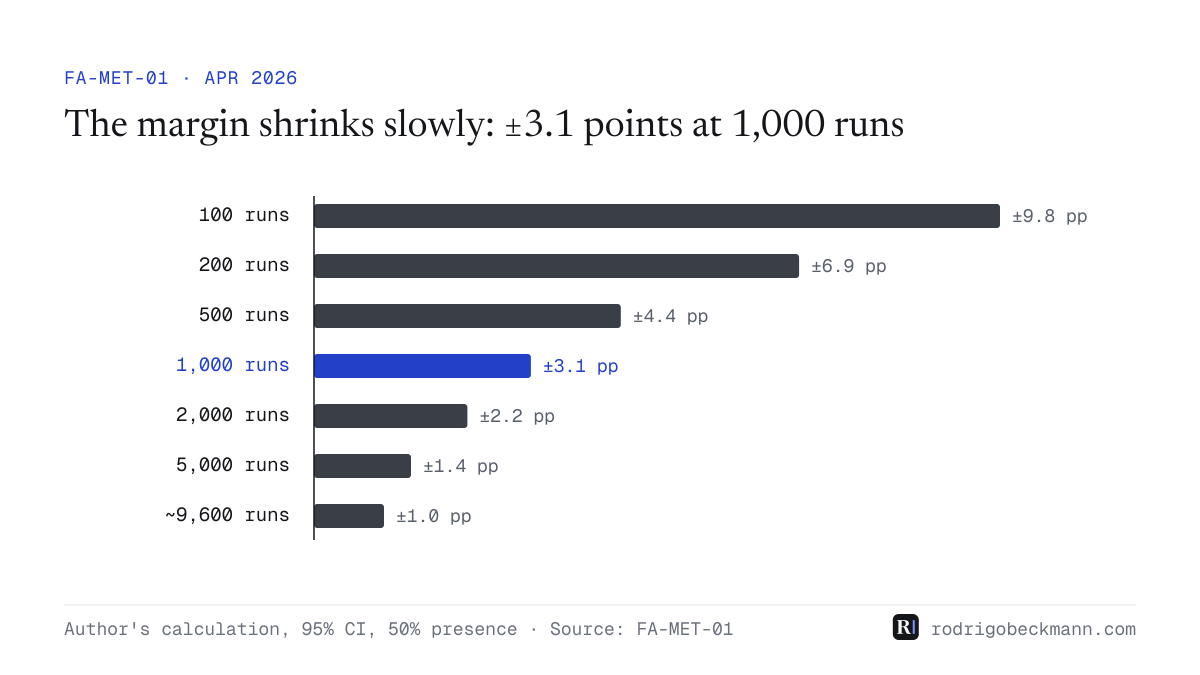
The curve explains why chasing too much precision does not pay. Halving the margin takes four times as many runs: going from ±3.1 to ±1 point costs almost ten times more collection.
Step 4: collect in fresh conversations and normalize brands
Each run has to be independent. In the FA-MET studies, each question was asked in a new conversation, so one answer could not influence the next.
Then comes extraction: identifying every brand mentioned in each answer and merging name variants into the parent brand. Without that normalization, “Brand X” and “Brand X US” become two brands, and both come out underestimated.
Step 5: read the margin before the number
Every measured presence comes with an interval. With 1,000 runs, a brand measured at 50% is, with 95% confidence, between about 47% and 53%. The FA-MET studies use the Wilson interval, which also behaves well near 0% and 100%.
Two practical consequences:
- Small differences are not change. Between two rounds of 1,000 runs, moves below ~4 points should be treated as noise.
- The tail is misleading. In the 5,000-run experiment, 29% of the rare brands seen in the first 1,000 runs did not come back in the next 4,000. A brand that showed up once or twice is not “present”.
Step 6: add what Google shows you
Since June 3, 2026, Search Console has had a generative AI report with a site’s impressions in AI Overviews, AI Mode and Discover. It is the only official data from a platform, but it covers only Google, shows impressions and not clicks, and started with a subset of sites. I covered it in detail here.
The two sources complement each other. Search Console tells you how often your pages appeared. Sampling tells you whether your brand gets recommended, including when the AI does not link to you.
What this measurement does not show
- The exact model. In the ChatGPT interface, logged out, you cannot fix or record which model answered.
- The brand mix in another context. The statistical regularity should hold for other models and environments. Which brands rise or fall, not necessarily.
- The logged-in user. The FA-MET studies did not test history, memory or personalization.
- The why. The count tells you who shows up, not why. For that you need to look at the cited sources.
How to judge any AI visibility number
Before trusting a report, including one of mine, ask for four things:
- How many answers were collected per question and per AI.
- Which environment: API or interface, logged in or not.
- What margin of error each number has.
- Which questions were used, and who wrote them.
They are the same questions I listed in the guide to evaluating a GEO specialist, and most of them became clauses in the GEO standard published in China. A number without those four answers is an anecdote formatted as data.
The yardstick in one sentence
AI visibility is a percentage with a margin, not a rank: many questions, a stated environment, a sample sized to the goal, and no conclusion drawn from a single answer.
Frequently asked questions
How do I know if my brand shows up in ChatGPT?
Ask the same question many times, each in a new conversation, and count how many answers mention the brand. One question is not enough: according to SparkToro, the chance that ChatGPT repeats the same list of brands in two answers is under 1 in 100.
How many prompt runs do I need to measure a brand's presence?
It depends on the goal. According to the methodological study FA-MET-01, from April 2026, with 7,000 runs in the ChatGPT interface, 100 to 200 runs show whether the market is concentrated and who leads it, within ±7 to 10 points; 1,000 runs measure each brand within ±3.1 points; ±1 point takes about 9,600.
Does measuring through the ChatGPT API give the same result as the interface?
No. In study FA-MET-02, with the same question and the same search tool, 12 of the 15 most relevant brands differed significantly between the API and the interface, and 64% of the 56 brands observed appeared in only one of the two environments.
What is AI share of voice?
It is the share of a category's mentions that goes to each brand across a set of AI answers. It comes from the same count as presence, the percentage of answers that mention the brand, and has the same requirements: a large sample, a stated environment and a margin of error.
Does Google Search Console measure visibility in AI answers?
Partly. The generative AI report, launched on June 3, 2026, shows a site's impressions in AI Overviews, AI Mode and Discover. It does not show clicks, position or competitors, and it does not cover ChatGPT, Perplexity or the Gemini app.
Sources
- FA-MET-01: How to Measure What an AI Recommends — First Answer, 30 Apr 2026 · primary source
- FA-MET-02: API or Interface: That Is the Question — First Answer, 30 Apr 2026
- NEW Research: AIs are highly inconsistent when recommending brands or products; marketers should take care when tracking AI visibility — SparkToro, 28 Jan 2026
- Introducing Search Generative AI performance reports in Search Console — Google Search Central Blog, 03 Jun 2026
